Trace: » demonstration_and_results
This is an old revision of the document!
For the final demonstration four optical sources were selected: a red LED, a yellow LED, a green LED, and a blue LED. The sources were inserted to be analyzed randomly. The program Hyperterminal was set to record and the spectrometer was turned on. The stepper motor rotated the bolt which translated the photodiode across the spectrum. The PIC microcontroller received the analog readings from the photodiode and converted them into a digital value. This value was transmitted via the RS232 connection in ASCII format to the computer. The Hyperterminal console monitored the output and recorded the results on a text pad. The process took approximately 6 minutes. This was repeated for the other three LEDs at random.
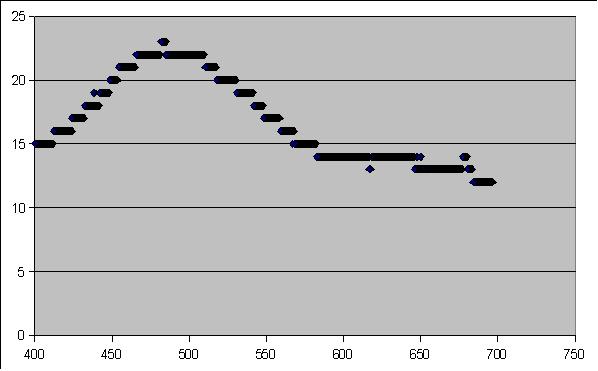
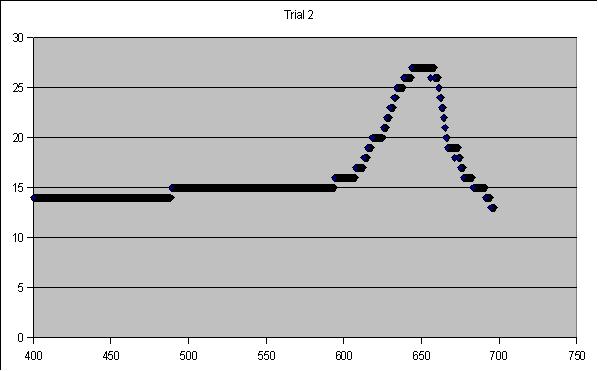
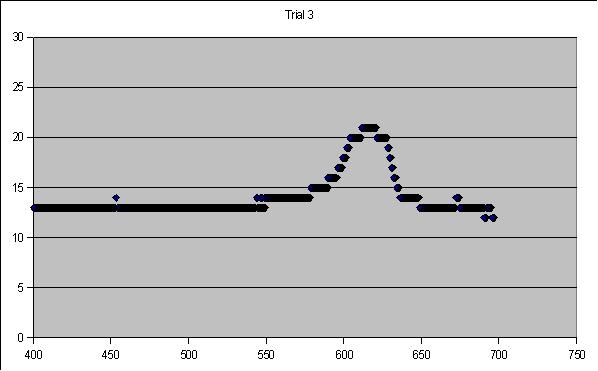
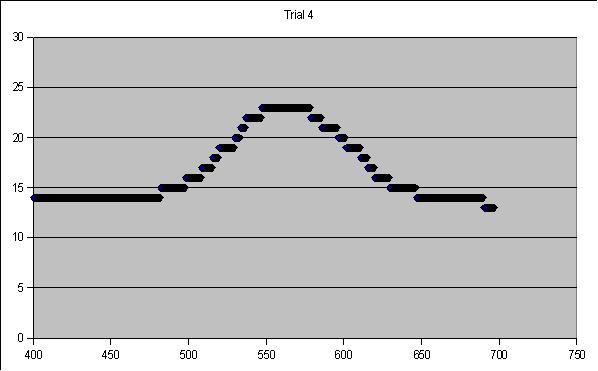
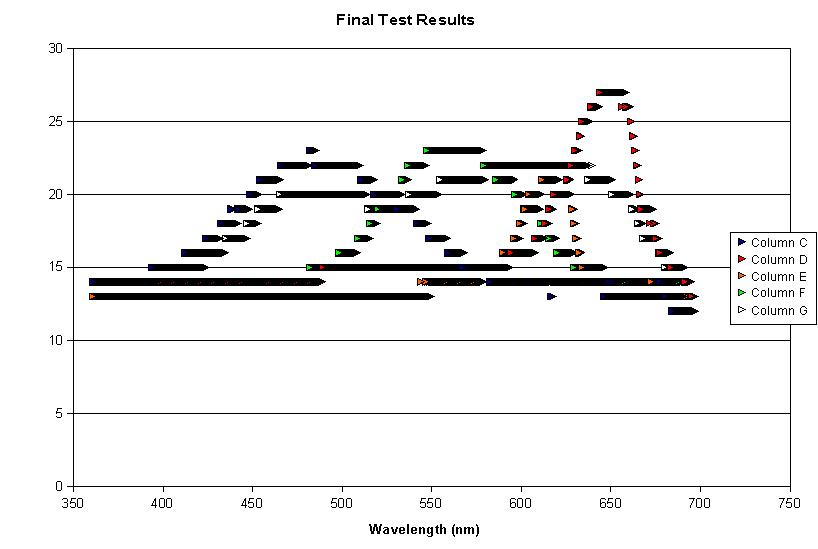
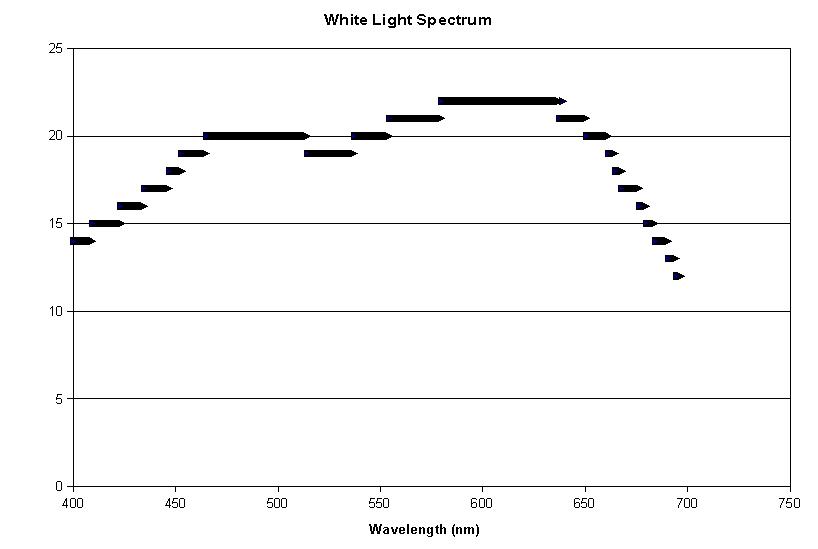
The output data on the text pad was plotted graphically. The graphs are presented in the random order they were chosen during the demonstration. The horizontal axis is wavelength (in nanometers) and the vertical axis is intensity (in [V/255 * 5] volts).
The spectrometer performed according to expectations and the resulting plots were reasonable. The first trial produced a graph with a short wavelength, with a mean peak of 481 nm. The second trial produced a longer wavelength with a mean peak of 650 nm. The third was longer than the second with a mean peak of 615 nm. The fourth was longer than the third with a mean peak of 561 nm.
You are here: start » group2 » demonstration_and_results
