**Spectrometer Final Design**
Proposed Design
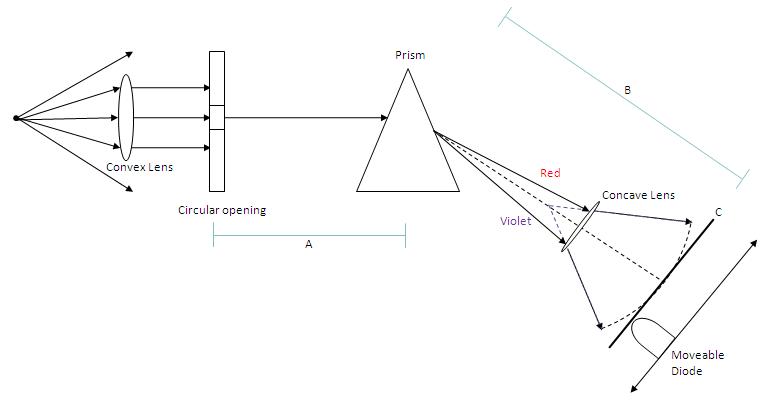
The spectrometer design which was chosen uses a prism to disperse visible light. The refractive index of the prism depends on the wavelength of light: red light will have a smaller refractive index than violet light. Since the light will leave the prism at different angles depending on the wavelength, it will be possible to use physical geometry to monitor the refracted light, and record a spectrum. The proposed design consists of three stages:
Stage 1: Collection Stage
The source light which will be analyzed is assumed to be un-collimated. A convex lens will be used in order to collimate the beam. A collimated beam is desirable, because a spread out beam will involve a more complex geometry. The detection stage will rely on a mechanical system (more on this below), and so it is important to remove any physical complexities when possible. The collimated light will then hit a surface with a small opening (<1mm diameter), entering the light isolated spectrometer structure. It is important to use a small opening in order to block out as much ambient light as possible. However, too small of an opening will block a lot of the input signal, and might cause difficulties in the detection stage.
Stage 2: Dispersion Stage
As mentioned above, a prism will be used to disperse the input light source. The prism will be kept fixed with the triangular face parallel to the horizontal surface, which will be the operating plane. The angle of incidence will be chosen appropriately . The angle between a refracted red beam and a refracted violet beam (this angle will be referred to as the working angle) is 11 . It is desirable to maximize this angle, without too much loss. It is proposed to use a divergent lens in order to increase the working angle to 40o . The refracted spectrum will then travel approximately 14 cm away from the prism. This number is chosen so that the detector will have to operate over a distance of approximately 10 cm.
Stage 3: Detection Stage
The detector was chosen to be a Si photodiode, because it operates over the visible range. The chosen diode has an intensity peak in the middle of the spectrum, and so the software used for data analysis must account for this. It was mentioned in the previous section that the working distance for the detector will be approximately 10 cm. The detector will move linearly, and its path is shown by line A in Figure 1. The dashed curve in Figure 1 represents an equal intensity curve: at this curve, every wavelength has traveled the same distance, and therefore got attenuated by the same amount. It is evident that the path of the diode will see an uneven intensity curve as it scans the spectrum. However, the attenuation of light can be expressed mathematically, and accounted for by the software. The advantage of having the diode move linearly is the simplification of the mechanical design. As was mentioned previously, the detection of individual wavelengths relies on physical geometry, and so requires a precise physical set up.
Figure 1: Spectrometer Schematics
